13 Detecting the two peaks of the claps (Part 1)
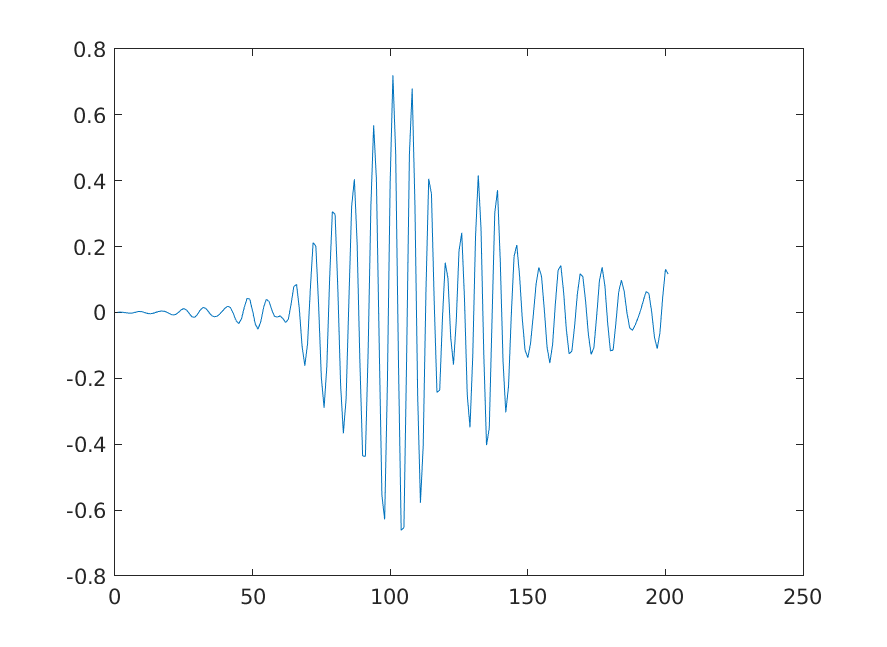
If you zoom in on the audio data around one of the claps you will see that the signal oscillates up and down rapidly. You can zoom in on one of the claps by typing the following into the Command Window:
% find the maximum value and its index in yFiltered
[maxY, iY] = max(yFiltered);
% plot yFiltered in the region around index iY
plot(yFiltered(iY - 100:iY + 100))
Zoom-in around one of the claps:
13.1 Envelope of the signal
Notice that there are many peaks even in one clap. We would like to unambiguously identify each clap by finding a single peak for each clap. We can do this by fitting an envelope around the audio data. An envelope is a pair of smooth curves that encloses the audio signal. The upper envelope encloses the upper half of the signal and the lower envelope encloses the bottom half of the signal. The upper and lower envelopes can cross each other depending on exactly how the envelopes are calculated.
To find the upper and lower envelopes of the filtered clapping data type the following into the Command Window:
[yupper,ylower] = envelope(yFiltered, 800, 'peak');
figure
plotAudio(yupper);
hold on
plotAudio(ylower);
hold off
You should see something resembling the following:
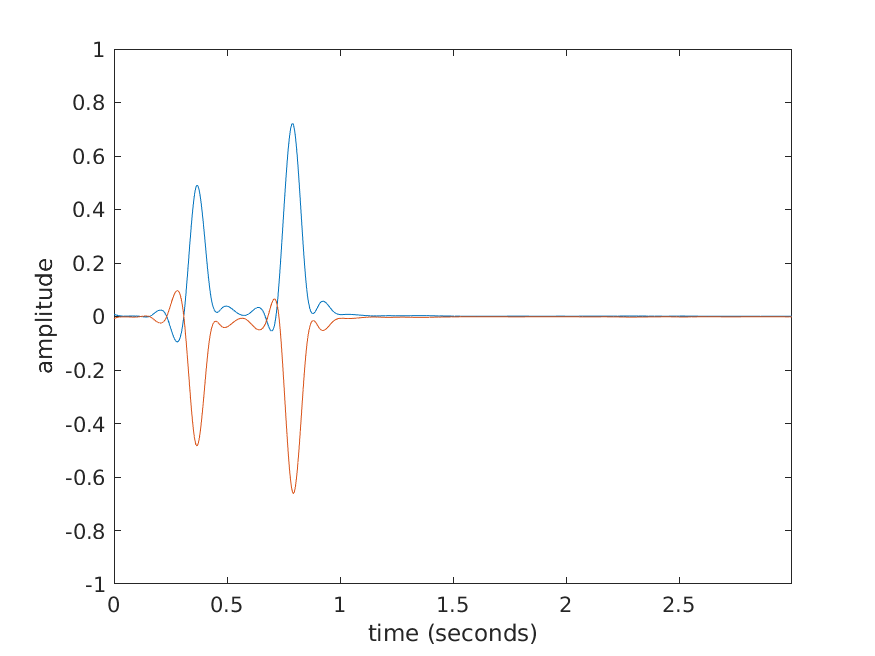
Notice that there are only two prominent peaks in the upper and lower envelopes.