10 Create a function to plot an audio vector
Edit the function named plotAudio.m that was provided to you. The function should plot an audio vector such that:
- the x-axis has units of time (in seconds)
- the y-axis is the amplitude of the audio data
- the y-axis limits are from -1 to 1
- the x-axis label is
time (seconds) - the y-axis label is
amplitude
In MATLAB, the amplitude of the audio data is always between -1 and 1.
Note that to plot y versus time you need to convert from indices to time; the starter code you downloaded includes the Lab 3 function index2time to help you do this. The sampling frequency of the audio recorder is 16000Hz. To compute the correct time vector you should do the following:
- the start time is 0
- the end time is the time corresponding to the last index of
y - the time vector can be computed using
linspaceusing the start time from Step 1, the end time from Step 2, and the number of elements is equal to the number of elements iny
Once you have the time vector it is a simple matter to plot y versus the time vector, adjust the y-axis limits, and set the axis labels.
10.1 Test your function
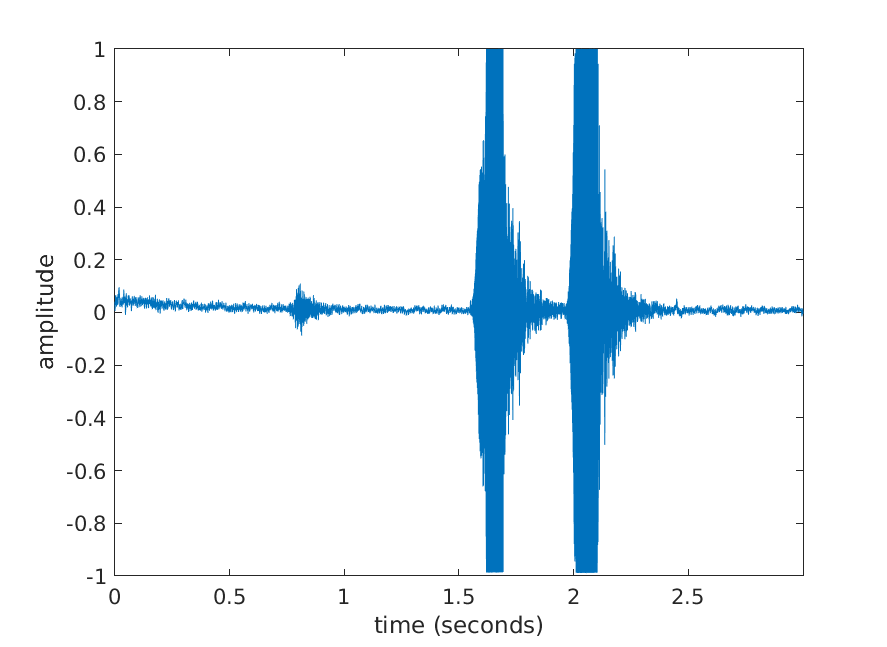
When your function is completed, test it by plotting a pre-saved audio vector by typing the following into the Command Window:
load whistle.mat
plotAudio(W)
W is an audio vector of two whistles. Your function should produce the following plot: