14 Plot the audio data
We can visualize the audio data by plotting it. Type the following commands into the command window:
duration = numel(y) / fs;
time = 0:dt:(duration - dt);
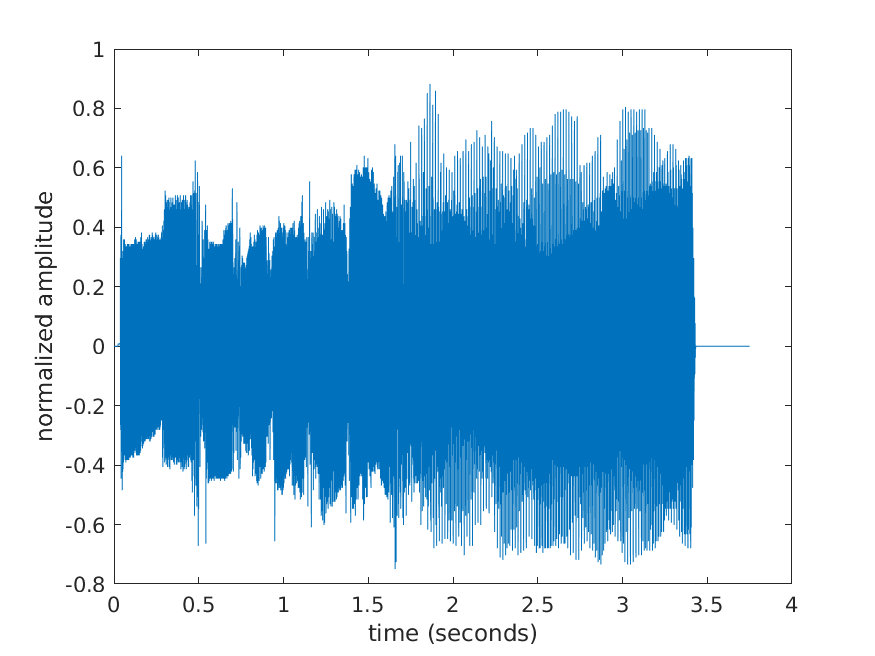
plot(time, y);
xlabel('time (seconds)');
ylabel('normalized amplitude')The value duration is the length of the audio data in seconds. It is equal to the number of elements in y divided by the time between samples.
The vector time is the vector containing the time in seconds when each element in y was sampled.
The plot should look like the following: