15 Plot the audio data 2
Because there are so many elements in y it is difficult to visualize the details of the audio data. We can visualize a small part of the audio data using indexing. Type the following commands into the command window:
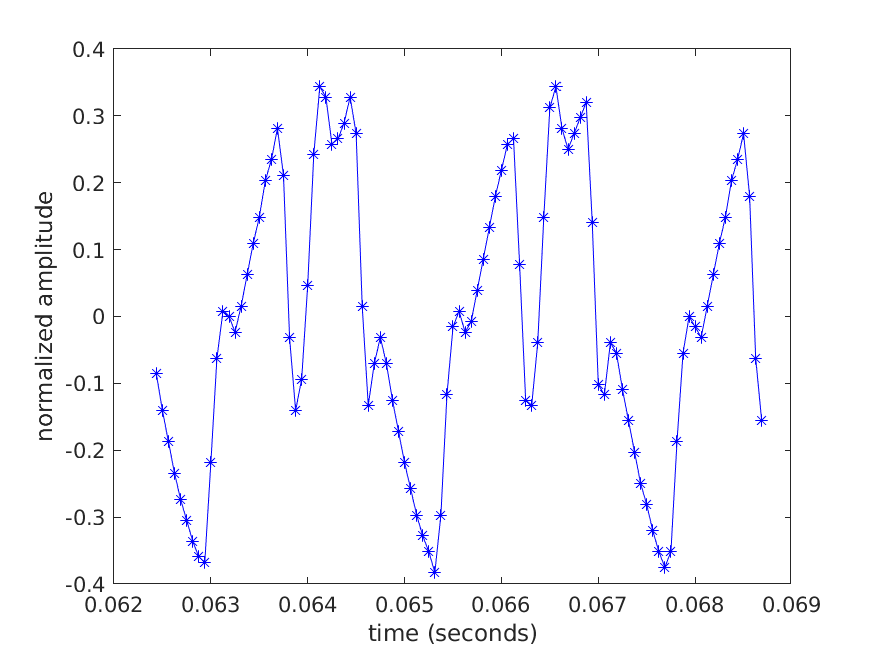
plot(time(1000:1100), y(1000:1100), 'b-*');
xlabel('time (seconds)');
ylabel('normalized amplitude')
Here, we’ve focussed in on a very short period of time of the audio data. We can see clearly that the audio data has an oscillating structure.
15.1 Selecting by starting and ending time
Notice that to select the part of the audio data that we wanted to inspect, we had to use the integer indices 1000 and 1100. It might be more convenient if we could select the start time and end time of the part of the audio data that we wanted to inspect. We will create a function that helps the programmer select part of an audio signal by specifying the starting and ending times.
In MATLAB create a new function by clicking on the New button found in the upper-left corner of the MATLAB desktop and selecting the Function menu item. The MATLAB editor should open with a template of a function.
Replace the contents of the newly created function with the following:
function [index, indexUp] = time2index(t, fs)
%TIME2INDEX Converts time to an index.
%   index = time2index(t, fs) converts a time in seconds t to an
%   index into a vector having sampling frequency fs in Hertz.
%   If t corresponds exactly to an integer index, then
%   that index is returned; otherwise, index is obtained
%   by rounding down.
%
%   [index, indexUp] = time2index(t, fs) also returns
%   indexUp. If t corresponds exactly to an integer index, then
%   index and indexUp are both equal to that integer index;
%   otherwise, indexUp is obtained by rounding up.


end
Complete the function so that it computes index and indexUp as described in the help documentation of the function.
Note that index and indexUp must be integer values. When you convert a time to an index, you will find that the calculation can produce non-integer values: index should be the non-integer value rounded down, and indexUp should be the non-integer value rounded up. For example, in the guitar riff data, which is sampled at 16000 Hz:
[index, indexUp] = time2index(0, 16000) should return 1 and 1
[index, indexUp] = time2index(0.5, 16000) should return 8001 and 8001
[index, indexUp] = time2index(1, 16000) should return 16001 and 16001
[index, indexUp] = time2index(2, 16000) should return 32001 and 32001
[index, indexUp] = time2index(0.123456, 16000) should return 1976 and 1977
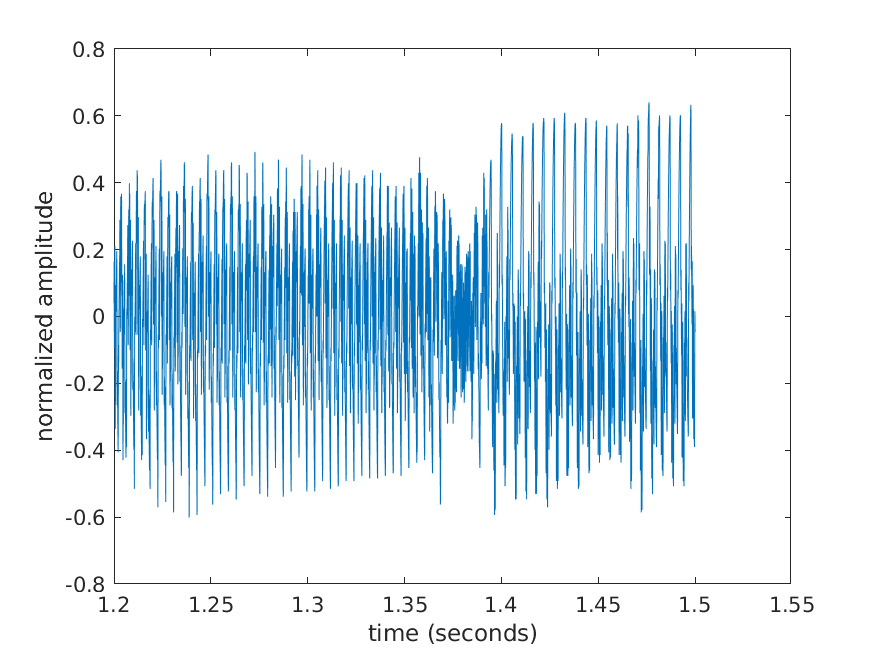
The following code should produce the plot shown below:
i1 = time2index(1.2, fs);
i2 = time2index(1.5, fs);
plot(time(i1:i2), y(i1:i2))  % plot the audio data from 1.2s to 1.5s
xlabel('time (seconds)');
ylabel('normalized amplitude')