5 Write a function that determines the location and angle of a line
Based on the discussion in Section 3 it should be clear that controlling the robot to follow the line requires finding the position and angle of the line in the image from the robot’s camera.
Complete the following function that finds the position and angle of a line in an image.
function [x, theta] = findLine(I)
%FINDLINE Find the position and angle of a line in an image
%   [x, theta] = findLine(I) finds the horizontal position x and angle
%   theta of a line in an image.
%
%   The position of the line is defined as the position of the line
%   in the middle row of the image. x is measured relative to the center
%   of the image with a negative value of x corresponding to a position
%   to the left of center and a positive value of x corresponding
%   to a position to the right of center. x is measured in pixels.
%
%   The angle of the line is measured relative to the horizontal
%   axis of the image. A vertical line has an angle of pi/2 radians,
%   a line sloped up and to the right has an angle of less than
%   pi/2 radians, and a line sloped up and to the left has an
%   angle of greater than pi/2 radians. The angle is always in the
%   range of 0 to pi.
%
%   This function assumes that the full width of the line is present
%   on the top and bottom rows of the image.
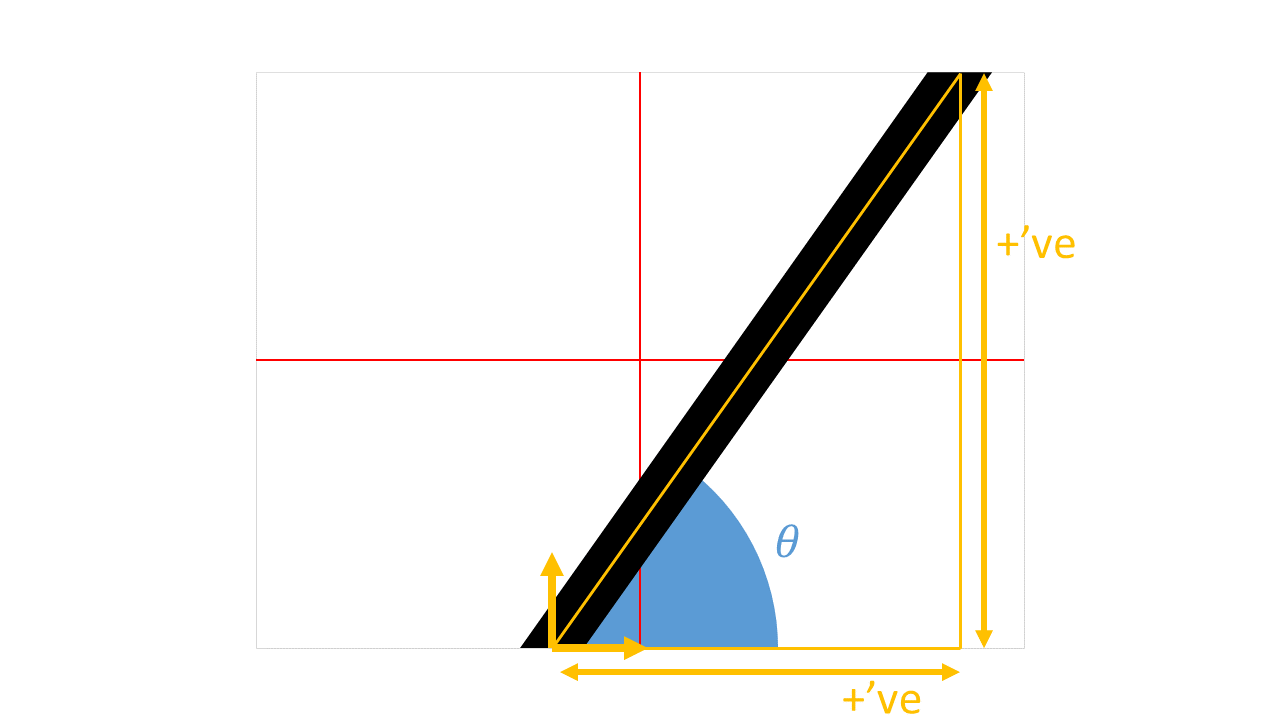
The function should compute the two values shown in blue in the image below:

Note that the position x is the location of the line in the middle row of the image and is measured relative to the center of the image. If the position of the line is on the right side of the image then the returned value of x should be positive. If the position of the line is on the left side of the image then the returned value of x should be negative.
The angle theta is measured relative to the horizontal. If the line is sloped up to the right then the value of theta is between \(0\) and \(\pi / 2\) radians. If the line is sloped down to the right then the value of theta is between \(\pi / 2\) and \(\pi\).
To compute theta you should use the function atan2 (four-quadrant inverse tangent). atan2 has two inputs Y and X.
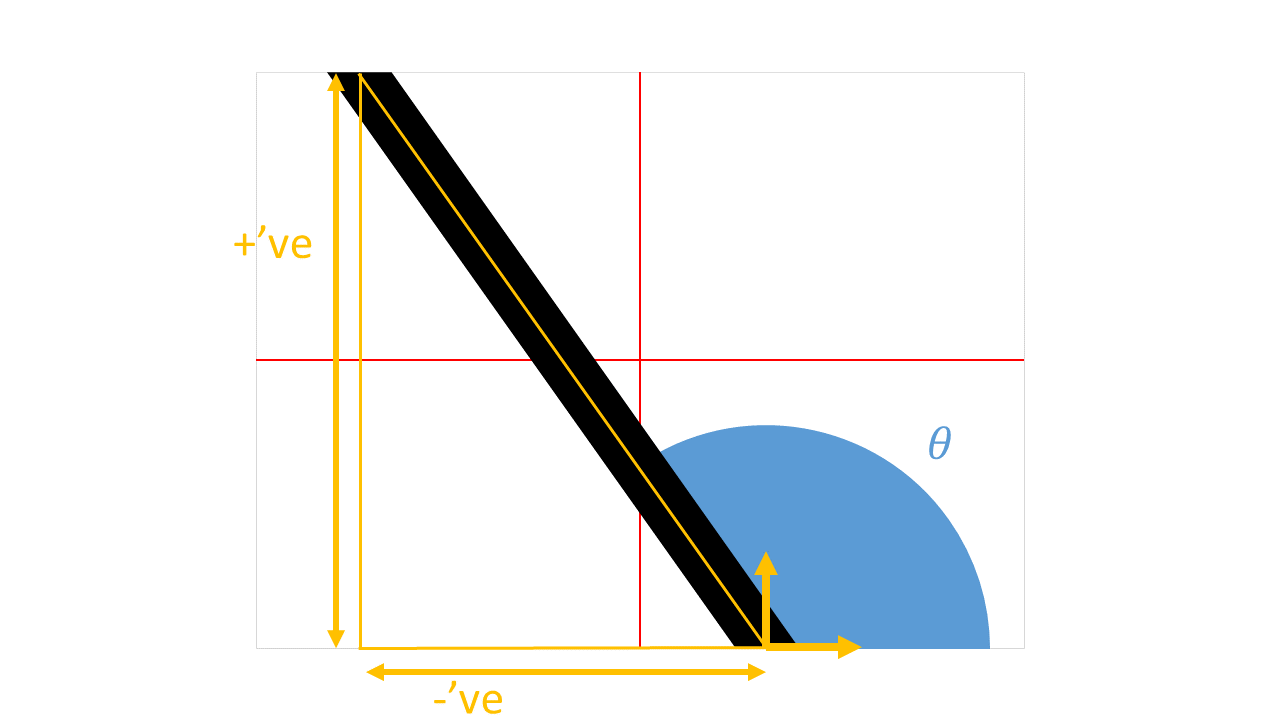
To use atan2 you create a triangle as shown in orange in the images below. Where the line intersects the bottom edge of the image you place a local coordinate frame. The values X and Y required by atan2 are the coordinates of the other end of the line measured in the local coordinate frame.
In both images below, the Y coordinate of end of the line is positive (because the end of the line appears in positive \(y\)-direction of the local coordinate frame); furthermore, the value of Y is equal to the number of rows in the image.
In the first image below, the X coordinate of the end of the line is positive (because the end of the line appears in positive \(x\)-direction of the local coordinate frame).
In the second image below, the X coordinate of the end of the line is negative (because the end of the line appears in negative \(x\)-direction of the local coordinate frame).
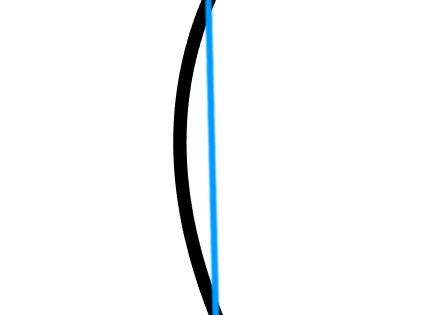
5.1 What about curved lines?
You should treat curved lines as though they were straight lines. In the image below of a curved line your function should return the location and angle of the straight line shown in blue.
5.2 Testing your function
In the lab files that you downloaded you will find the 7 test images line1.png through line7.png. You can test your function using these images (change line1 to use a different test image):
I = imread('line1.png');
imshow(I)
[x, theta] = findLine(I)
The approximate expected values are shown in the table below; your function might return slightly different values depending on exactly how you measure the line.
| Test line | x |
theta |
|---|---|---|
| line1 | -83 | 0.9527 |
| line2 | -30.75 | 2.3522 |
| line3 | 1.50 | 1.5930 |
| line4 | -169 | 1.3192 |
| line5 | -169 | 1.8224 |
| line6 | 170 | 1.3192 |
| line7 | 170 | 1.8224 |