2 Loops
Begin by creating a script named q2.m and copy the following Matlab code into the script:
% q2.m

% do not change the variable t on the next line
t = linspace(0, 2 * pi, 500);

% (a) Answer part (a) below this comment


% (b) Answer part (b) below this comment


% (c) Answer part (c) below this comment
(a) [5 marks]
Create a vector v whose elements are equal to:
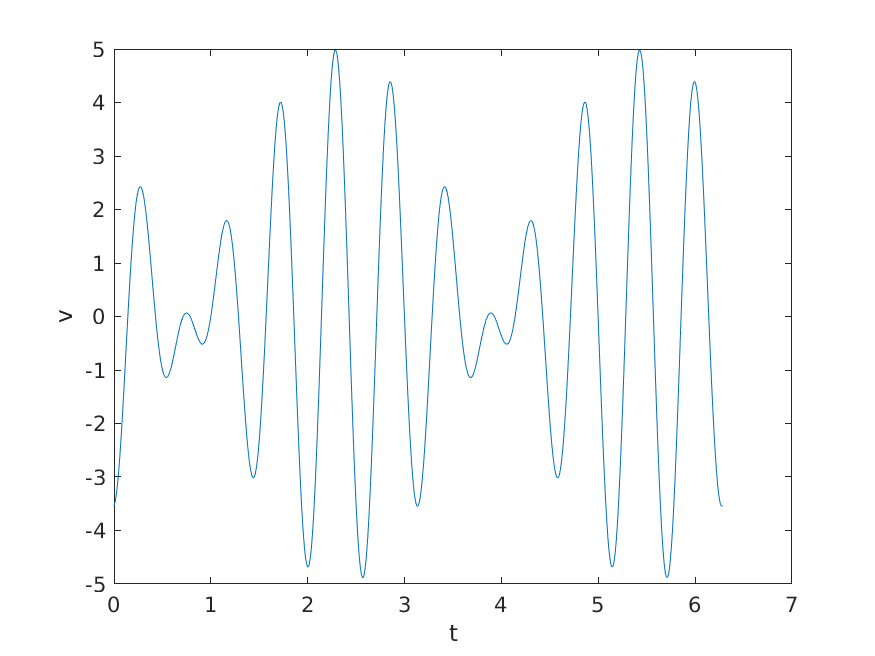
\[ v = 5 \sin(t - \frac{\pi}{4}) \cos(11t) \]
where \(t\) is the vector defined for you in the script. The vector v is a simple example of amplitude modulation.
If you cannot correctly compute the vector v then set v to the vector having elements 1, 2, 3, ..., 500 so that you can attempt parts (b) and (c).
If you plot v verus t you should get the following:
(b) [5 marks]
Create a vector w of all zeros that has the same size as v.
Write a loop that sets the element at index i of w to the value
\[ i \times v_i \]
where \(v_i\) is the element at index i of v.
You must use a loop to solve this problem. You may use any function that determines the length or size of an array and the function zeros. No other functions are allowed.
Hint
w(1)is equal to1 * v(1)w(2)is equal to2 * v(2)w(3)is equal to3 * v(3)- and so on
(c) [10 marks]
Notice that in the figure shown in part (a) the value of the function \(v\) oscillates; the value of \(v\) (at \(t=0\)) increases until approximately \(t=0.3\) where it starts to decrease. The location where the value starts to decrease is a peak (or local maxima) in \(v\). We say that a peak occurs where the value of \(v\) is greater than the previous value in \(v\) and greater than the next value in \(v\).
Write a loop that finds the values in v of all of the peaks. Store the vector of values in a variable named peaks.
You must use a loop and an if (or if-else or if-elseif) statement to solve this problem. You may use any function that determines the length or size of an array. No other functions are allowed.