3 Plotting
Open and edit the script q3.m provided to you to answer the parts of this question.
(a) [1 mark]
Make a column vector named yr having the values 1 through 12 in steps of 1. Your vector should have 12 elements.
(b) [1 mark]
Make a column vector named co2byMonth having the following values (you can copy-and-paste the values):
406.1, 406.4, 407.2, 409.0, 409.7, 408.8, 407.1, 405.1, 403.4, 403.6, 405.1, 406.8These values represent the atmospheric concentration of carbon dioxide in parts per million for each month in the year 2017.
(c) [4 marks]
To the script add the MATLAB commands needed to plot the values in the vectors yr and co2byMonth to reproduce the following figure:
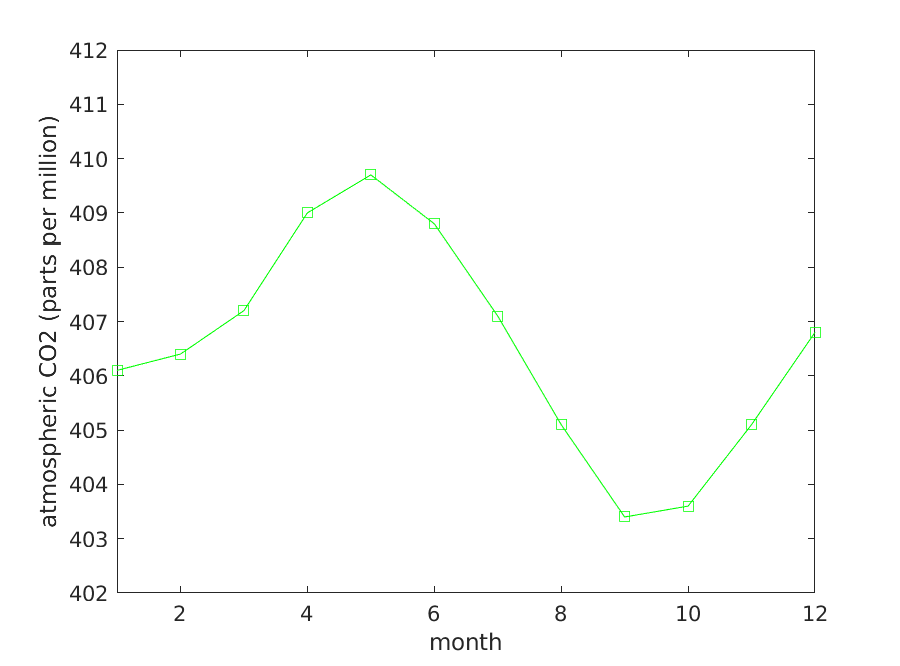
Running the script should reproduce the above figure exactly (including the limits of the axes).