CSE1541 Lab 07
Random variables and simulation
Tue Mar 11, 2014
Due: Mon Mar 17 before 11:59PM
Introduction
This lab has you write small scripts and functions to perform some small simulations; Questions 3 and 4 are especially relevant for students studying experimental physics.
You should put the MATLAB code for your simulations in a single script; the first question also requires you to write a function.
Question 1: The infinite monkey theorem
In Professor Stewart's Hoard of Mathematical Treasures, Ian Stewart writes: "It is said that if a monkey sat at a typewriter and kept hitting keys at random, then eventually it would type the complete works of Shakespeare. This statement dramatises two things about random sequences: anything can turn up, and, therefore, the result need not appear random. The infinite monkey theorem goes further, and states that, if the monkey keeps typing for ever, then the probability that it will eventually type any given text is 1."
To test this theorem, complete the following function:
function [ s ] = randstr(n)
%RANDSTR Random all uppercase string of letters
%  S = RANDSTR(N) returns a random all uppercase string of length
%  N where the characters are English letters.

% NOTE TO STUDENTS: the letters A through Z correspond to the
% integers 65 through 90, respectively. To implement this function,
% all you need to do is generate a row vector of N random integers
% between 65 and 90 inclusive and convert the vector to a string
% using the function 'char'


end
Using your function, write a simulation that runs for 1,000,000 trials.
Each trial, use your function to generate a random 3-letter string.
Count the total number of times that the string 'ROM' appears (the first
three letters of ROMEO) in the 1,000,000 trials, and output the count
at the end of all of the trials. Use the MATLAB function strcmp
to compare two strings for equality.
The Wikipedia article on the infinite monkey theorem contains some interesting results; in particular, what happened when the theorem was tested using actual monkeys http://en.wikipedia.org/wiki/Infinite_monkey_theorem#Real_monkeys.
Question 2: The birthday problem
A classic problem in introductory statistics is the birthday problem: In a group of N people, what is the probability that at least two people share the same birthday (ignoring the year). Write a simulation to study this problem for values of N = 1, 2, 3, ..., 80.
Your simulation should use the integers 1, 2, ..., 365 to represent the days of the year (ignoring Feb 29 that occurs during leap years). For each value of N, generate 10,000 groups of N random birthdays and count the number of groups that contain duplicated birthdays; store this count in a vector named C having length N. After your simulation is complete, plot (C / 10,000) versus the vector 1:N; you should get a figure similar to the graph on Wikipedia http://en.wikipedia.org/wiki/Birthday_problem
How can you tell if a vector of birthdays contains one or more duplicated
birthdays? Look at the help for the MATLAB function unique.
Question 3: Propagation of errors I
Science students are taught that when measuring two independent quantities Δx1 and Δx2 that are being added or subtracted, the error in the sum or difference is the square root of the sum of the absolute errors squared:
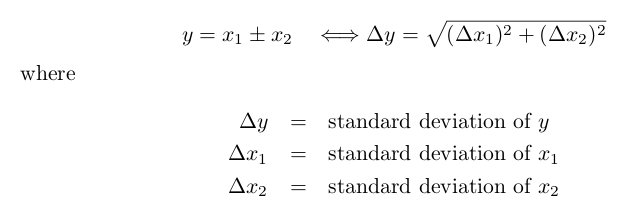
Is the equation correct? Write a simulation to check the validity of the equation:
- generate a vector
x1that has 1,000 elements; each element should be equal to10plus normally distributed noise having standard deviationΔx1 = 1.5 - generate a vector
x2that has 1,000 elements; each element should be equal to-10plus normally distributed noise having standard deviationΔx2 = 2 - compute the sum
y = x1 + x2 - plot the histograms of
x1,x2, andyon the same figure (usehold onbetween histograms) - compute and show the value of
Δyusing the equation above - compute and show the sample standard deviation of
y
If you have done everything correctly, the results of Steps 5 and 6 should be similar.
Question 4: Propagation of errors II
Science students are taught that when measuring a scalar quantity Δx1, the error in a function of the quantity is given by:
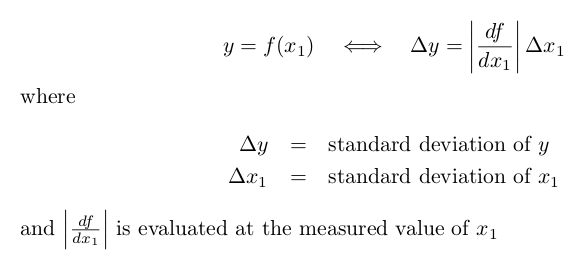
Is the equation correct? Consider the following example:
- generate a vector
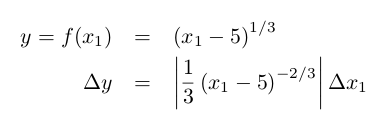
x1that has 1,000 elements; each element should be equal to6plus normally distributed noise having standard deviationΔx1 = 1 - compute the function
y = (x1 - 5)1/3 - plot the histogram of
x1 - in a separate figure, plot the histogram of
y - compute and show the value of
Δyusing the equation above; evaluate the derivative atx1 = 6 - compute and show the sample standard deviation of
y
If you have done everything correctly, the results of Steps 5 and 6
should be quite different. In a comment, briefly explain why the
estimated error Δy from Step 5 is different than the sample
standard deviation from Step 6.
Submit
You should have 1 function and 1 script to submit.
Submit your 2 files using the online submit service: https://webapp.eecs.yorku.ca/submit/