CSE1541 Lab 06
Summary statistics and data analysis
Tue Mar 04, 2014
Due: Mon Mar 10 before 11:59PM
Introduction
This lab has you write small scripts and functions to perform summary statistics calculations and data analysis.
Each question requires you to show some result using the function created in the question; you should put the MATLAB code that shows the results in a single script.
Question 1
Chapter 12, Exercise 4. You should use this file for the question; download and save the file in your MATLAB working folder.
The question is repeated below in case you did not bring your textbook:
A batch of 500-ohm resistors is being tested by a quality engineer. A file called testresist.dat stores the resistances of some resistors that have been measured. The resistances have been stored one per line in the file. Load the information from the file and calculate and print the mean, median, mode, and standard deviation of the resistances. Also, calculate how many resistors are within 1% of 500 ohms.
Question 2
Chapter 12, Exercise 10. You should read the modified version of the question below. Test your function by reading in the data from this file; download and save the file in your MATLAB working folder.
The file contains a noisy signal with one sample from the signal
per line. Load the signal from the file, plot the signal x,
and in a separate figures, plot
the result of the following:
medfilter(x, 5)medfilter(x, 51)medfilter(x, 151)
The signal is a noisy sine wave. What do you notice as the filter size increases? What happens for the largest filter size of 151?
The question is repeated below in case you did not bring your textbook:
A median filter on a vector has a size; for example, a size of
3 means calculating the median of every three values in the vector.
The first and last elements are left alone. Starting from the
second element to the next-to-last element, every element of
a vector vec(i) is replaced by the median of
[vec(i-1), vec(i), vec(i + 1)]. For example, if the
signal vector is:
signal = [5 11 4 2 6 8 5 9]
the median filter with size of 3 is medfilter(signal, 3)
[5 5 4 4 6 6 8 9]
Write the function medfilter that receives a signal
vector and the size of the median filter, and computes and returns
the median filtered result. You may assume that the size of the filter
is always a positive odd number.
Question 3
In this question, you will learn how to use the MATLAB function
textread. The latest MATLAB documentation says that
textread is not recommended and that
textscan should be used instead, but we don't know how
to use cell arrays or file identifiers, so we will use textread
for now.
Experimental data is often stored in an ad hoc file format. If you are
lucky, the file format uses plain text to store the data (if you are
unlucky then the problem of reading the data becomes much harder).
textread allows you to read in text-based data that has
some sort of regular structure (if the file format has an irregular
structure then the problem of reading the data becomes much harder).
Open this file in your web browser. The file contains processed data from one of my research experiments. The data is obviously in tabular format, consists of mostly numeric information, and has some textual description in the form of column headers.
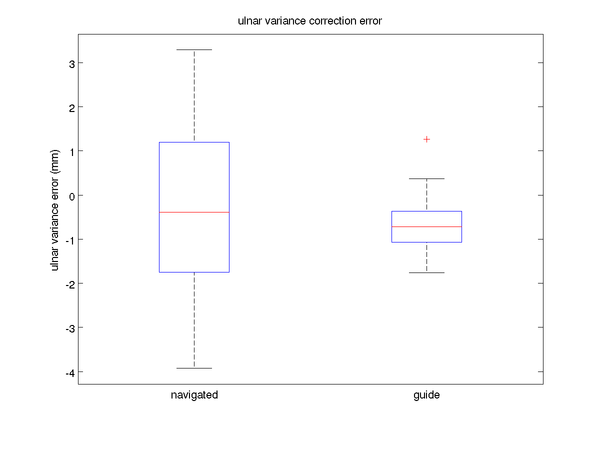
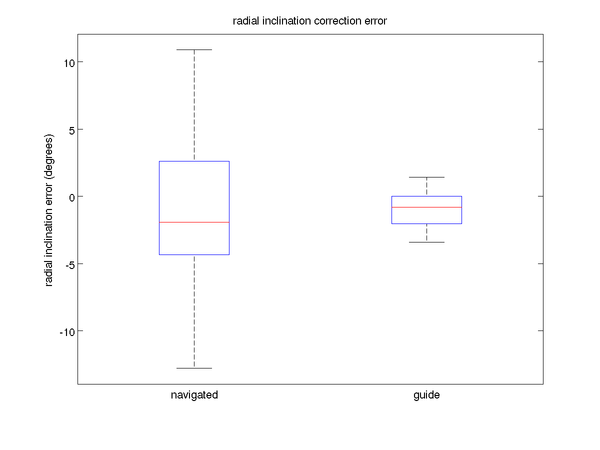
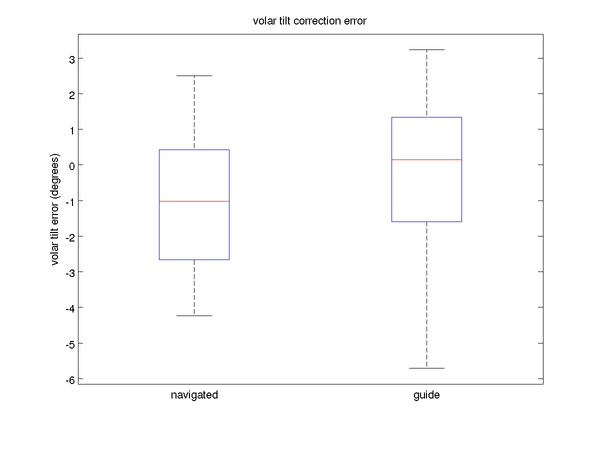
The first three columns of numbers are error measurements obtained when surgeons performed a particular type of operation using computer-assisted navigation. The three kinds of error measured are clinically important anatomic measurements called "ulnar variance", "radial inclination", and "volar tilt". Ideally, these correction errors should be equal to zero.
The last three columns of numbers are error measurements obtained when surgeons performed the same type of operation using a guide that was customized to the anatomy of the patient. The same error measurements were also performed for this group.
The first four lines of the file indicate the group for the measurements (computer-navigated versus individualized guides) and the type of error measurements (ulnar variance, radial inclination, volar tilt).
Save a copy of the data file in your MATLAB working folder.
Read the documentation for the textread function and use
textread to read in the numeric data from the file.
Once you have read the data, use boxplot to generate
the boxplots similar to the three shown below. Which technique
seems to work better?
Bonus question
This question is strictly for interest sake; you are not expected to submit a solution to this question.
It is generally accepted that Professor Ignaz Semmelweis was the first to identify the mode of transmission of puerperal sepsis, an often fatal infection of the female reproductive organs contracted during childbirth. Under modern healthcare, the infection is rare and treatable, but the infection was much more common and lethal when it was not understood that doctors themselves were largely responsible for spreading the disease because of the lack of sanitizing their hands.
A modern analysis of Semmelweis' data is presented in the following article: www.ncbi.nlm.nih.gov/pmc/articles/PMC2870773 Read the article, paying particular attention to how Figure 1 was generated.
An Excel spreadsheet containing Semmelweis' data can
be found here.. Download the spreadsheet, inspect how the data is represented
in the spreadsheet, and load it into Matlab using xlsread. Reproduce
Figure 1 from the article (not including the smooth dashed curves).
You should use the function find to find the indices of years
in the first column of the data for the various time periods (1784-1822,
1823-1847, 1833-1846, 1847-1849, 1850 onwards). Once you have the
indices, it is easy to extract the relevant information from the
various columns of the data.
Submit
You should have 1 function and 1 script to submit.
Submit your 2 files using the online submit service: https://webapp.eecs.yorku.ca/submit/