CSE1541 Lab 02
Functions and vectors
Tue Jan 21, 2014
Due: Thu Jan 23 before 11:59PM
Introduction
This lab uses MATLAB to study sinusoidal waves. This lab has the following components:
- a short demonstration illustrating certain aspects of plotting graphs
- a series of MATLAB exercises based on the second week of lecture material; students will provide their solutions in a published report and submit the report using the EECS submit service
Sinusoidal waves: Part 1
This is an in-lab demonstration. The purpose of this short demonstration is to illustrate certain aspects of plotting graphs.
Amplitude of a sinusoidal wave
The simplest form of a sinusoidal wave as a function of time (t) is:
The parameter A is called the amplitude of the wave. Using MATLAB, we can easily see how changing A changes the shape of the wave:
%% Lab 2 Sinusoidal waves
% This lab uses MATLAB to explore sinusoidal waves.

%% Amplitude
% Plot three sinusoidal waves each having a different amplitude
% for time t from -3 seconds to 3 seconds in steps of 0.01 seconds

t = -3:0.01:3;
A1 = 0.5;
A2 = 1;
A3 = 2;
y1 = A1 * sin(2 * pi * t);
y2 = A2 * sin(2 * pi * t);
y3 = A3 * sin(2 * pi * t);
plot(t, y1, 'r', t, y2, 'b', t, y3, 'c');
xlabel('time (s)');
ylabel('y(t) = A sin(t)');
legend('A = 0.5', 'A = 1', 'A = 2');

% NOTE: You could also use the command hold to hold the current figure:
%
% plot(t, y1, 'r');
% hold on
% plot(t, y2, 'b');
% plot(t, y3, 'c');
% hold off
Sinusoidal waves: Part 2
Add to the script created during the demonstration to explore the remaining aspects of sinusoidal waves as described in the remainder of this lab. The goal is to generate a report that clearly communicates the principles of sinusoidal waves. Publish your script as a web page. When you are finished, submit both your script and published report using the EECS submit service.
In your scripts, please show how you calculated your answers using MATLAB. Please use appropriate variables rather than repeatedly typing in the same numbers.
Frequency
A more general form of the sinusoidal wave is:
where f is the frequency of the wave. The frequency is the number of cycles of the wave that occur over 1 second. The SI unit for frequency (or counts per unit time) is called the hertz (Hz). The sinusoidal waves used in the demonstration used a frequency f = 1 Hz.
The period is the amount of time in one cycle, and is equal to 1 / f. The sinusoidal waves used in the demonstration had periods of 1 second.
Create a plot, or plots, illustrating how changing the frequency changes the shape of the wave; you should use a single value for the amplitude to isolate the effects of changing frequency. You should use at least one frequency value less than 1 Hz and at least one frequency value greater than 1 Hz.
Phase
A more general form of the sinusoidal wave is:
The angle φ is called the phase and is measured in radians. If we set time t = 0 in the equation above, we can see that φ determines where in the cycle the wave is at t = 0
Create a plot, or plots, illustrating how changing the phase changes the shape of the wave. You should use negative and positive values of φ.
Interference
Sinusoidal waves are unique in that the sum two sinusoidal waves having the same frequency is another sinusoidal wave, even if the amplitude and phase of the two waves are different. If the difference in phase of the two waves is a multiple of 2π then the amplitude of the resulting wave is the sum of the amplitudes of the original two waves; this phenomenon is called constructive interference. If the difference in phase of the two waves is an odd multiple of π then the amplitude of the resulting wave is the absolute value of the difference of the amplitudes of the original two waves; this phenomenon is called destructive interference. If the phase difference is some other value, then the resulting amplitude lies somewhere between the amplitudes resulting from constructive interference and destructive interference.
Visually show that this is true by creating some plots that illustrate the effects of summing two sinusoidal waves having the same frequency but different amplitudes and phases. You should illustrate constructive interference, destructive interference, and something in between.
Making different waves using sinusoidal waves
It is a mathematical fact that any periodic function can be represented as an infinite sum of sinusoidals called the Fourier series. The Fourier series is named after Jean-Baptiste Joseph Fourier who used such series to solve the famous heat equation.
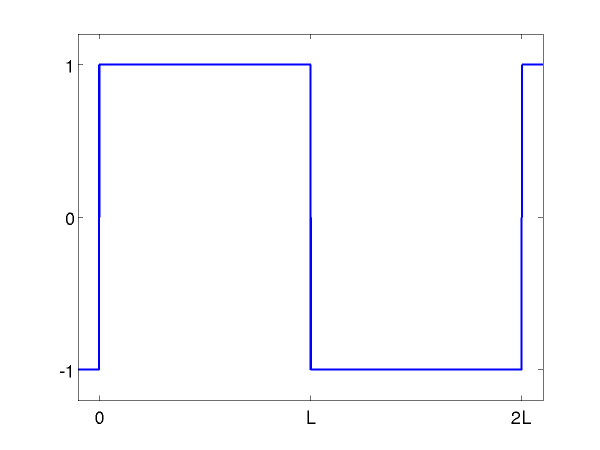
The square wave having amplitude 1, phase 0 radians, and period equal to 2L is shown in the figure below:
The Fourier series for the square wave is given by:
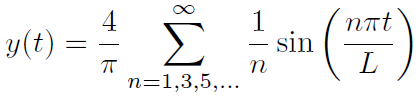
Obviously, we cannot physically create a square wave by using an infinite number of sinusoids; however, we can approximate a square wave by using a finite number of sinusoids.
Create a plot that illustrates the construction of a square wave using the first 1, 2, 3, and 4 terms of the Fourier series (i.e., your plot should have 4 curves that become successively better approximations of the square wave). Create a second plot that shows the squared error for each of the four curves (the squared error is the square of the difference between the ideal square wave and the finite series approximation).
Submit
Submit your MATLAB script and report at https://webapp.eecs.yorku.ca/submit/